Recognizing Why Answers to Visual Questions Differ

Overview
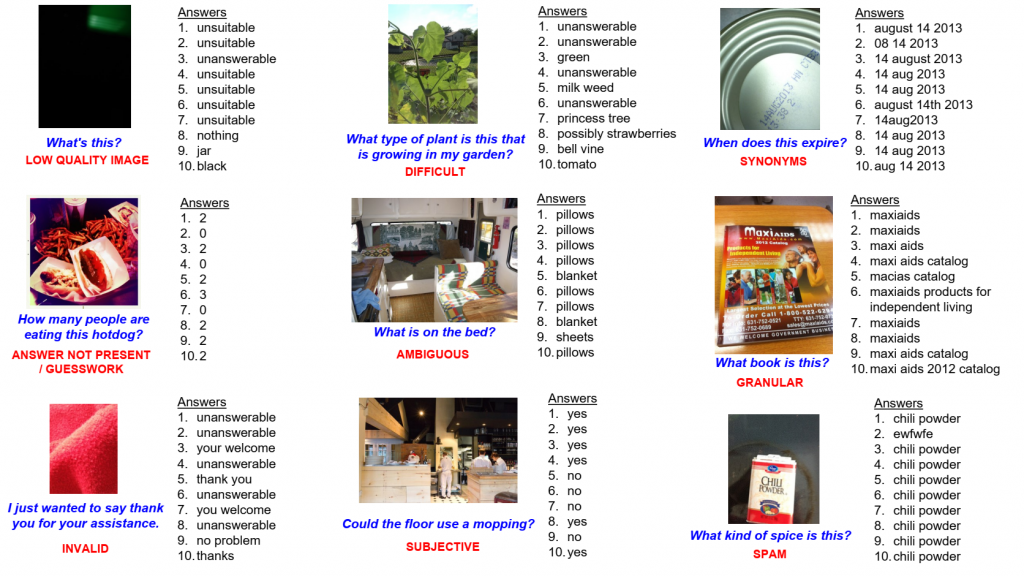
Visual Question Answering is the task of returning the answer to a question about an image. A challenge is that different people often provide different answers to the same visual question. We present a taxonomy of nine plausible reasons explaining why the answers can differ, and create two labelled datasets consisting of ∼45,000 visual questions indicating which reasons led to answer differences. We then propose a novel problem of predicting directly from a visual question which reasons will cause answer differences as well as a novel algorithm for this purpose.
To our knowledge, this is the first work in the computer vision community to characterize, quantify, and model reasons why annotations differ. We believe it will motivate and facilitate future work on related problems that similarly face annotator differences, including image captioning, visual storytelling, and visual dialog. We publicly share the datasets and code to encourage community progress in developing algorithmic frameworks that can account for the diversity of perspectives in a crowd.
Answer-Difference Dataset
The Answer-Difference dataset includes:
- Images
- 29,907 from VizWiz dataset – train, validation, test
- 12,816 from VQA 2.0 dataset *
- Annotations
- Visual Question (Question-Image Pair) with 10 answers
- Reasons for answer difference
* Some visual questions in VQA 2.0 ask about the same image.
Training, Validation, and Test Sets
- Training Set
- 19,176 from VizWiz
- 9,735 from VQA 2.0
- Validation Set
- 3,063 from VizWiz
- 1,511 from VQA 2.0
- Test Set
- 7,668 from VizWiz *
- 3,788 from VQA 2.0
* Test set annotations for VizWiz dataset are not publicly shared, since this may provide clues for the ongoing VQA challenge.
The download files are organized as follows:
- Annotations are split into three JSON files: train, validation, and test.
- Each annotation record has the following format:
"qid":"VizWiz_train_00000005.jpg",
"image":"VizWiz_train_00000005.jpg",
"question":"What's this?",
"src_dataset":"VIZWIZ",
"answers":[
    "boots",
    "shoes",
    "shoes",
    "shoes",
    "boots",
    "unanswerable",
    "feet",
    "feet",
    "shoes",
    "someones feet"
],
"ans_diff_labels":[1,0,0,0,3,0,4,3,0,0]src_datasetcan take 2 values:VIZWIZorVQAans_diff_labelsdenote the reasons for answer difference, in the following order:[LQI, IVE, INV, DFF, AMB, SBJ, SYN, GRN, SPM, OTH]
The numbers denote how many crowd workers (out of 5) selected a particular reason. Details about the meaning of each label are shared in the paper.

This work is licensed under a Creative Commons Attribution 4.0 International License.
Challenge
Our proposed challenge is designed around the VizWiz Answer-Difference dataset and addresses the following task:
Task
Given a Visual Question (Question-Image Pair) with 10 answers, the task is to predict why the 10 answers might differ, from a taxonomy of plausible reasons (labels) for answer-difference: LQI, IVE, INV, DFF, AMB, SBJ, SYN, GRN, SPM, and OTH. The submissions will be evaluated based on the mean average precision across all labels.
The team which achieves the maximum mean average precision across all the labels wins this challenge.
Submission Instructions
Evaluation Servers
Teams participating in the challenge must submit results for the VizWiz-Test portion of the Answer-Difference dataset (i.e., 7,668 visual questions) to our evaluation servers, which are hosted on EvalAI. Teams are NOT required to submit results for the 3,758 visual questions from the VQA 2.0 portion of the dataset.
Uploading Submissions to Evaluation Servers
To submit results, each team will first need to create a single account on EvalAI. On the platform, then click on the “Submit” tab in EvalAI, select the submission phase (“test”), select the results file (i.e., JSON file) to upload, fill in required metadata about the method, and then click “Submit”. The evaluation server may take several minutes to process the results. To have the submission results appear on the public leaderboard, check the box under “Show on Leaderboard”.
To view the status of a submission, navigate on the EvalAI platform to the “My Submissions” tab and choose the phase to which the results file was uploaded (i.e., “test”). One of the following statuses should be shown: “Failed” or “Finished”. If the status is “Failed”, please check the “Stderr File” for the submission to troubleshoot. If the status is “Finished”, the evaluation successfully completed and the evaluation results can be downloaded. To do so, select “Result File” to retrieve the aggregated accuracy score for the submission phase used (i.e., “test”).
Submission Results Formats
Use the following JSON formats to submit results for both challenge tasks:
results = [result]
result = {
    "image": string, # e.g., 'VizWiz_test_000000020000.jpg'
    "ans_dis_labels": [0, 0, 0, 0, 1, 0, 1, 1, 0, 0]
     #  corresponding to reasons for answer difference, in the following order:
     # [LQI, IVE, INV, DFF, AMB, SBJ, SYN, GRN, SPM, OTH]
}
Leaderboards
The Leaderboard page for the challenge can be found here.
Rules
- Teams are allowed to use external data to train their algorithms. The only exception is that teams are not allowed to use any annotations of the test dataset.
- Members of the same team are not allowed to create multiple accounts for a single project to submit more than the maximum number of submissions permitted per team on the test-challenge and test-standard datasets. The only exception is if the person is part of a team that is publishing more than one paper describing unrelated methods.
Code
The code for the algorithm results reported in our ICCV 2019 publication is located here.
Publication
- Why Does a Visual Question Have Different Answers?
Nilavra Bhattacharya, Qing Li, and Danna Gurari. IEEE International Conference on Computer Vision (ICCV), 2019.
Contact Us
For questions about algorithms and code, please send them to Qing Li at liqing@ucla.edu.
For questions about the dataset, please send them to Nilavra Bhattacharya at nilavra@ieee.org.
For other questions, comments, or feedback, please send them to Danna Gurari at danna.gurari@colorado.edu.